Instrucciones para instalación de Excel Add-In
- Presione el botón para Descargar archivo Add-In Excel. Descarga
-
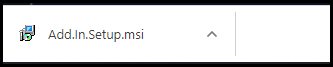
Descargar el archivo "Add.In.Setup.msi". Seleccionar Abrir.
-
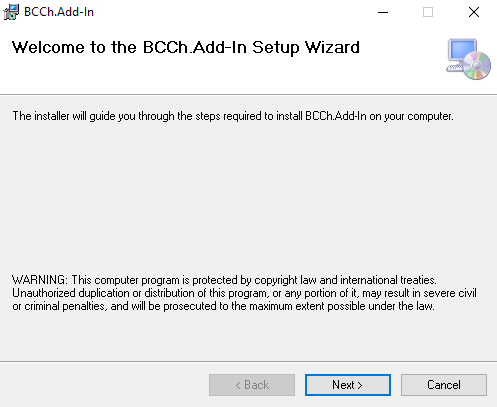
En la ventana del instalador (WIzard), seguir instrucciones por defecto para instalar.
-
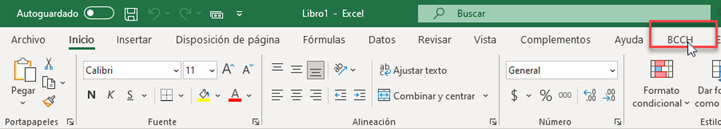
La próxima vez que inicie Microsoft® Excel®, se mostrará la pestaña "BCCh" como se indica en el siguiente ejemplo:
-
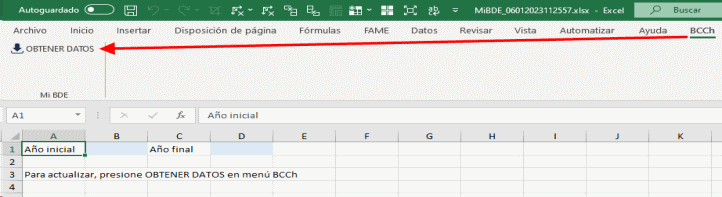
Ingrese Año Inicial y Final en las celdas correpondientes de la hoja y dentro de la pestaña "BCCh" podrá utilizar la funcionalidad Mi BDE presionando botón OBTENER DATOS.
Para mayor información sobre agregar o quitar complementos Office consulte en el siguiente enlace:
https://support.microsoft.com/es-es/office/agregar-o-quitar-complementos-en-excel