Excel Add-In Installation Instructions
- Press the button to Download Excel Add-In File. Download
-
Download and Open "Add.In.Setup.msi" file.
-
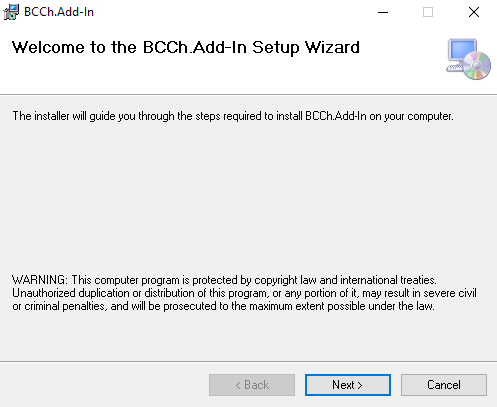
In the Wizard window, follow default instructions.
-
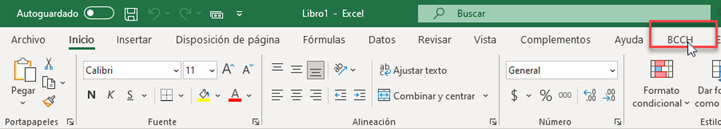
The next time you start Microsoft® Excel®, the "BCCh" tab will be displayed as shown in the following example:
-
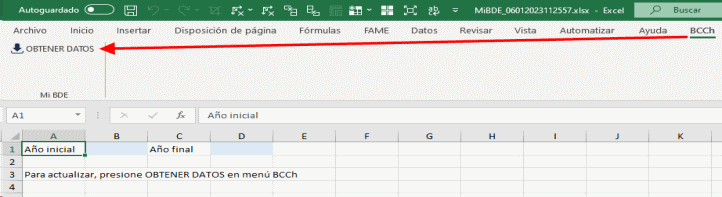
Enter Start and End Year in the corresponding cells and press button OBTENER DATOS within the "BCCh" tab to execute Excel dynamic query functionality.
For more information about adding or removing Office add-ins, see the following link:
https://support.microsoft.com/es-es/office/agregar-o-quitar-complementos-en-excel