NC: No corresponde cálculo dado que uno de los valores para la determinación de la variación, es negativa.
Eliminar canasta
Base de Datos Estadísticos - Exportar serie(s) a excel
Mi BDE
Instrucciones para instalación de Excel Add-In
Presione el botón para Descargar archivo Add-In Excel.
Descarga
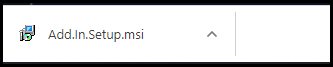
Descargar el archivo "Add.In.Setup.msi". Seleccionar Abrir.
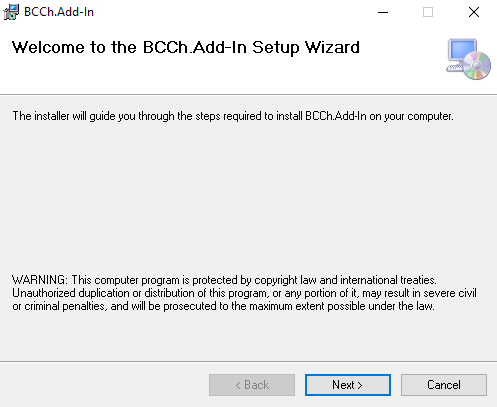
En la ventana del instalador (WIzard), seguir instrucciones por defecto para instalar.
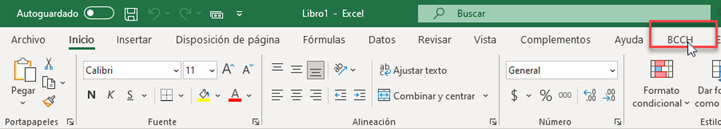
La próxima vez que inicie Microsoft® Excel®, se mostrará la pestaña "BCCh" como se indica en el siguiente ejemplo:
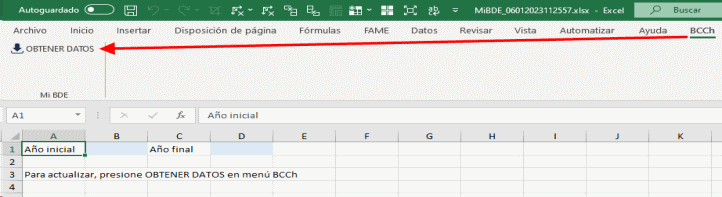
Ingrese Año Inicial y Final en las celdas correpondientes de la hoja y dentro de la pestaña "BCCh" podrá utilizar la funcionalidad Mi BDE presionando botón OBTENER DATOS.